
In dt, we use an internal system called DRE (Developer Runtime Environment), which allows us to grab information about how the code we write is executed while making a minimal impact on the code itself.
What makes DRE especially awesome?
We can use it to help debug and solve problems that other users are having. To accomplish this, once we are aware that a particular user is having an issue, we can add DRE logging to this user, usually limiting the logging to the part of the site in which they are having the problem. We can then use the log to check for any errors that might show up.
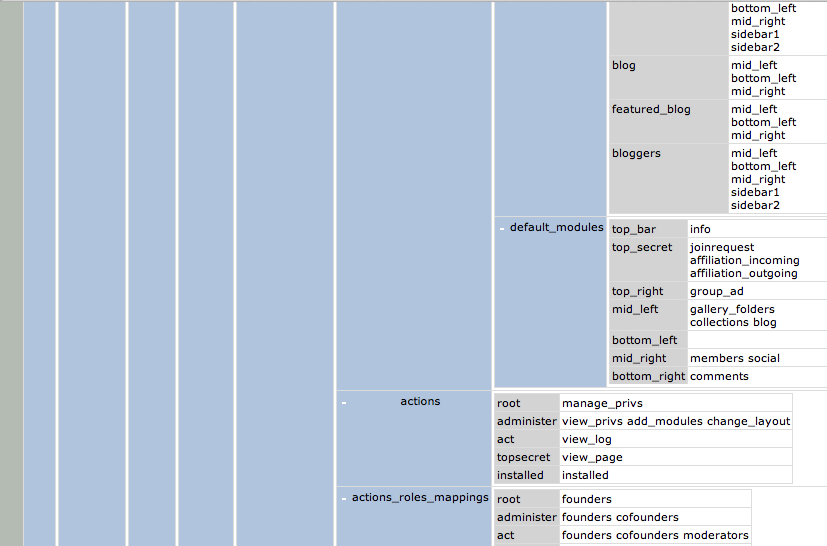
For example, say a user named testera is having trouble with a journal. We can log debug data for him when he visits journal pages. Examining that log, several pieces of information are stored, many of which will give us a better idea of where the point of failure is. We might want to check privileges the user has or what roles they have in a group if that's where the journal is being posted.

We take this type of logging very seriously, so don't be
We also store the logs so we're able to link them to other developers (and even then, we only store those logs for a few hours).
Why is it helpful to developers?
Because we load all debug information in a single window, it is accessible either by clicking a box at the top of any page or through F2. DRE can log simple data types but it can also provide a highly readable breakdown of complex objects using nested tables.
We also use it to set up alerts. If a high-risk condition occurs on a particular page, the box used to display DRE will turn red and pulsate to make it more apparent to us that there is a problem. This could be something as simple as a failure to retrieve data or something as severe as a failure to include a file (or worse, a fatal error).
More importantly, it allows us to trace data and debug across multiple layers, including processes that are non-web-facing or for asynchronous tasks, where the data may not be immediately available at runtime.
It's not just for fixing bugs; it's also for helping us spotting slow-loading modules and queries and seeing where we can better optimize the number of queries we do need to run on any given page.
For example, on this page, we have 12 separate queries that run:

This is pretty good, given all the data that has to be loaded to make DeviantArt run.
But on a different page, we might have 52 queries, some which are very similar and loading data from the same tables. If we can find a way to cull them together, we can reduce the number of queries, which will help the site perform better. We have a way of handling this in dt, a technique called wenching (which is combining several queries into a single query--we'll get to this in a future article), but we might not be aware that something needs to be wenched until we get a composite look of everything taking place on the page. This is where DRE comes into play.
We can also use it for profiling to see when a file in particular is taking a long time to load. This might be because the code in that file has inefficiencies that need to be refactored. For example, here's a page just to show you how this might look:
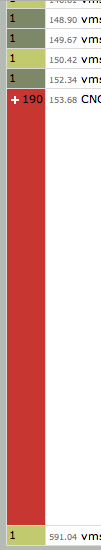
Eek. Bad, right? Fortunately, this isn't something we see too much of. And when we do, we try to remedy it.
So how does it work?
This is a silly impractical example, but it'll do.
$orders = $this->get_orders();
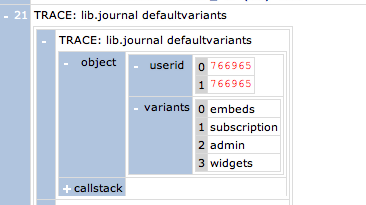
dre_trace('orders', $orders);
If get_orders() returns an object of orders, DRE will trace that object into a table, labeled "orders". Simple enough.
"This sounds like it could be kind of messy when you have a bunch of developers all using it! If everyone is using DRE, the panel would be completely overwhelmed with junk I don't care about!"
Yep. That's why we use dre_trace() sparingly. We have several functions for DRE, one which takes a parameter to filter the message to only those who want to see it. For example, if I wanted to make sure only I saw $orders from the aforementioned example in our DRE panel:
$orders = $this->get_orders();
dre_cond_trace('fartprincess', 'orders', $orders);
At the end of the day, this utility saves developers a massive amount of time.
